Accompanying rapid industrialisation over the past couple of decades, China has become the world’s largest producer and consumer of inorganic and organic chemicals. At the same time, China’s intensive agricultural sector is a major user of chemical fertilizers and pesticides. A major side effect of these industries is widespread serious water pollution throughout the nation, in both groundwater and surface water. Water pollution poses a serious threat to human and ecological health. The Chinese Central Government recently released the ‘Ten point plan’ for water pollution control and prevention, in an effort to curb water pollution and improve water quality throughout China. However, comprehensive data on the scale and extent of pollution in ground and surface water basins has to date been limited, making the task of identifying pollution sources and pathways, and cleaning them up more difficult.
Three articles recently published as a result of research collaboration between the Institute of Geographic Sciences and Natural Resources Research (IGSNRR) and RMIT University’s School of Engineering have shed new light on the severity China’s water pollution crisis in both groundwater and surface water, and the important factors and mechanisms that have contributed to the problems.
A review paper by the team published in Environmental Pollution examined concentrations of nitrate in groundwater for 52 major groundwater basins in China, including shallow and deep aquifers. The data show that the 90th percentile nitrate concentration exceeds the US EPA maximum contaminant level (10 mg/L NO3-N) in 25 out of 36 shallow aquifers, and 10 out of 37 deep aquifers. In certain basins, the median nitrate concentration also exceeded these levels. Particularly serious nitrate contamination occurs in the northern coastal regions of China (such as the coastal regions near Bohai Bay). Analysis of the stable isotopes of nitrogen and oxygen in nitrate reveal a range of sources of nitrate pollution, including chemical fertilizers, as well as domestic wastewater and manure. Of particular concern is evidence that nitrate, a common ‘indicator pollutant’, has reached deep aquifers, through mechanisms such as bypass flow along faulty wells. These aquifers are generally assumed to be relatively safe sources of drinking water. Researchers argue that a program to identify, fix and maintain deep wells throughout China is needed to protect these aquifers from further pollution.
The second paper was published in Science of the Total Environment in 2016, focused on persistent organic pollutants (POPs) in China’s waterways – including rivers, reservoirs, lakes, groundwater and marine water. These are toxic compounds that are highly resistant to breakdown in the environment, and can accumulate in ecosystems and humans. The compounds are so far not routinely monitored in China’s waterways. The review of data from more than 200 published studies found that organo-chlorine pesticides (OCPs) occur in China’s waterways at similar levels to other countries in Asia and around the world. However, polycyclic aromatic hydrocarbons (PAHs) and Poly-chlorinated biphenyls (PCBs) occur at elevated levels relative to other regions of the world for which data are available (e.g. PAH levels were between 15.1 and 72400 ng/L; PCBs between 0.2 to 985.2 ng/L).
Using diagnostic ratios, they found that PAH pollution is largely due to the intensive fossil fuel combustion occurring in China, which is also responsible for chronic air and soil pollution. Serious PCB pollution in China’s waterways appears to be due to emissions and waste from China’s intensive manufacturing sector, as well as global trade in e-waste, which results in hazardous materials being shipped to China. Areas of China with particularly serious POPs pollution include the Yangtze River basin, Pearl River Delta and Zhejiang province. These are all areas of intensive industry, including manufacturing and chemical industries, in China’s southeast. Strategies for mitigating POPs are also discussed.
The third paper issues in Environment Magazine in 2017. Researchers explore the international links to China’s water pollution crisis. The article describes how rapid growth of China’s economy in the early 21st century was linked to it becoming an international destination for many energy intensive and polluting industries, contributing to the pollution China currently faces. They present how ‘displacement of environmental harm’ across international boundaries was encouraged by trade agreements and policies of the international community and China. The‘winners and losers’ from these developments are examined, in the context of major ongoing health and environmental impacts in China.
References
Han, D., Currell, M.J., Cao, G. (2016). Deep challenges for China’s war on water pollution. Environmental Pollution 218: 1222-1233.
Han, D., Currell, M.J. Persistent organic pollutants in China’s surface water systems. Science of the Total Environment (in press)
Currell, M.J., Han, D. (2017). The Global Drain: Why China’s water pollution problems should matter to the rest of the world. Environment: Science and Policy for Sustainable Development 59(1): 16-29.
 |
|
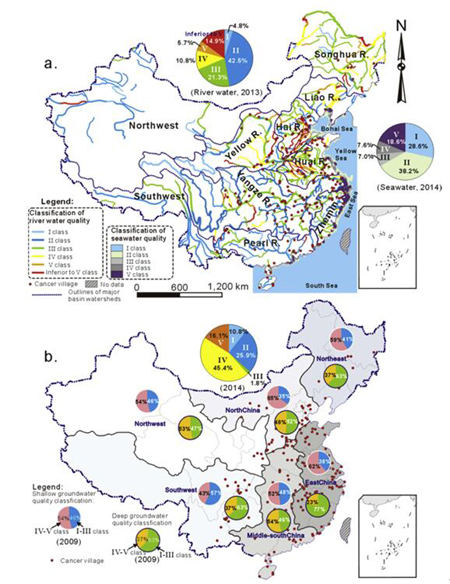
Figure 1– Status of water pollution in China based on recent government statistics - A) Surface water (major rivers and seawater) ranked according to the 6-class water quality classification (GB 3838-2002 – see Table 1) and seawater quality of offshore areas ranked according to the 5-class classification (GB3097-1997); B) Groundwater ranked using the 5-class system (GB/T 14848-93) in 6 sub-areas of China, including shallow and deep groundwater. Overall percentages in each class for each water source in China are shown as the large pie-charts.(Image by HAN Dongmei) |
 |
| Figure 2–Nitrate concentrations in groundwater from major groundwater systems in China: a) Location map of the 52 total study areas from which data were compiled; Boxplot distributions of nitrate concentrations (as N) in shallow groundwater (b) and deep or karst groundwater (c) throughout China. Boxplots show median, inter-quartile range and 10thand 90thpercentile values.(Image by HAN Dongmei) |
 |
|
Figure 3–Schematic figure showing sources and transport processes for persistent organic pollutants, and their interaction with the hydrological cycle. Numbers indicate classes of POPs reviewed in this study; 1 = Polycyclic aromatic hydrocarbons (PAHs); 2 = Organochlorine pesticides (OCPs); 3 = Polycholorinated Biphenyls (PCBs); 4 = Perfluorinated compounds (PFCs).(Image by HAN Dongmei) |